web app ideation
data visualization, interaction design
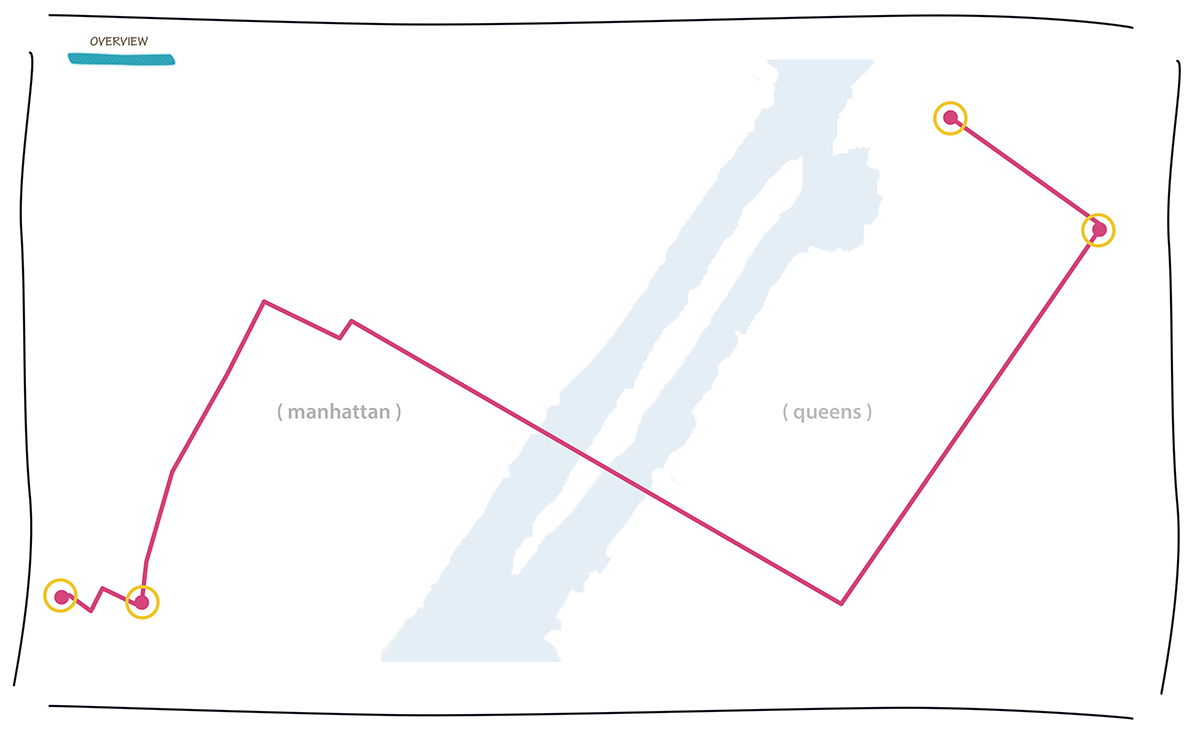
Interactive visualization of tweets relative to a particular site/location in New York. Goal was to push the boundaries of the ways that data is conventionally defined, conceptualized and displayed. Data points captured:
tweets key words from events throughout the day
time specific time of day
location coodinates of geo-located tweet
What follows is the thought process of UI and functionality from sketch to early prototype.
note: personal project; not for client


